Handover Cont..
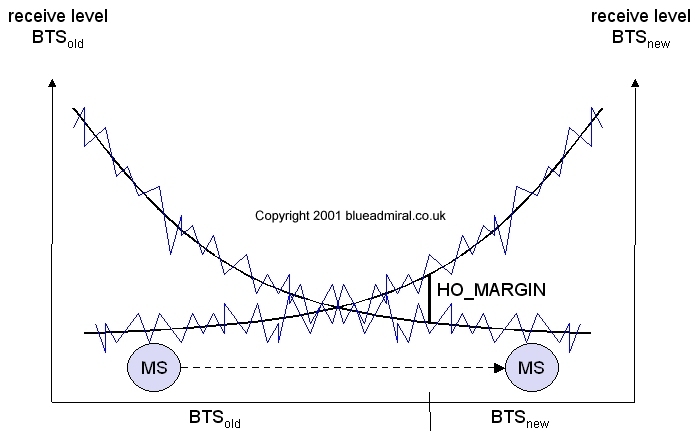
Figure 12 A Typical Handover decision, made depending on the RxLev
Figure 12 shows a handover decision,
using the RxLev as the MS moves away from the BTSold (BTSold is
the serving cell) towards another BTS (BTSnew). In the handover
decision shown in figure 12, the handover decision is made not
purely on the instantanious value of the receive signal level,
but on the average value.
So what's happening. The BTS collects all the values (RxLev and
BER from the uplink and downlink) from the BTS and MS, then calculates
the average values. These values are then compared to the Handover
Margin (HO Margin). The HO Margin includes a hysteresis level
to avoid the "ping-pong" effect (Wong, 1997). (Without
hysteresis, even short-term interference, e.g. shadowing due to
a building, could cause a handover). However, even with the HO
Margin some ping-pong can still occur. If the HO Margin is set
to high then this could cause dropped calls due to low RxLev,
and if it is set to low then there will be many handovers in a
short period, hence the ping-pong effect and a significant reduction
in the quality of the service.
The HO Margin will change between rural and urban areas, but typically will be set at -8db.
The following three figures shows the typical measurement reports, and cell details for a handover. These measurements were taken using TEMS Investigation 2.02, supplied by Ericcson.
Typical Measurement reports for
a Handover
Figure 13 Measurement Reports
Before Handover
(Source Ericsson Network Optimization Solutions, TEMS Investigation
2.02)
Figure 14 Handover Command
(Source Ericsson Network Optimization Solutions, TEMS Investigation
2.02)
Figure 15 Measurement Report
after Handover
(Source Ericsson Network Optimization Solutions, TEMS Investigation
2.02)